Once a year the brush country acquires a number. Texas Parks and Wildlife runs roadside surveys along fixed routes in late summer through its upland game bird program and publishes what the observers find. The figure gets repeated all autumn, usually stripped of the method that produced it, and by the time it reaches a conversation it has quietly turned into a claim about how many birds exist. It is not that. It is a real measurement with a narrow and knowable reach, and reading it well means holding both halves at once.
What a fixed route is
The design is deliberately rigid. The same routes are run, in the same places, by the same method, in the same part of the year, at the same time of day. Observers travel the route and record the birds they detect. Nothing about that is casual, and the rigidity is the point: repeating an identical procedure is what makes one season comparable with another.
Comparability is the product being manufactured here. A survey that changed its routes or its hours to chase birds would produce larger numbers and no information, because the difference between two years would no longer be attributable to the birds. Consistency is bought at the cost of coverage, and that trade is made knowingly.
What that design cannot reach
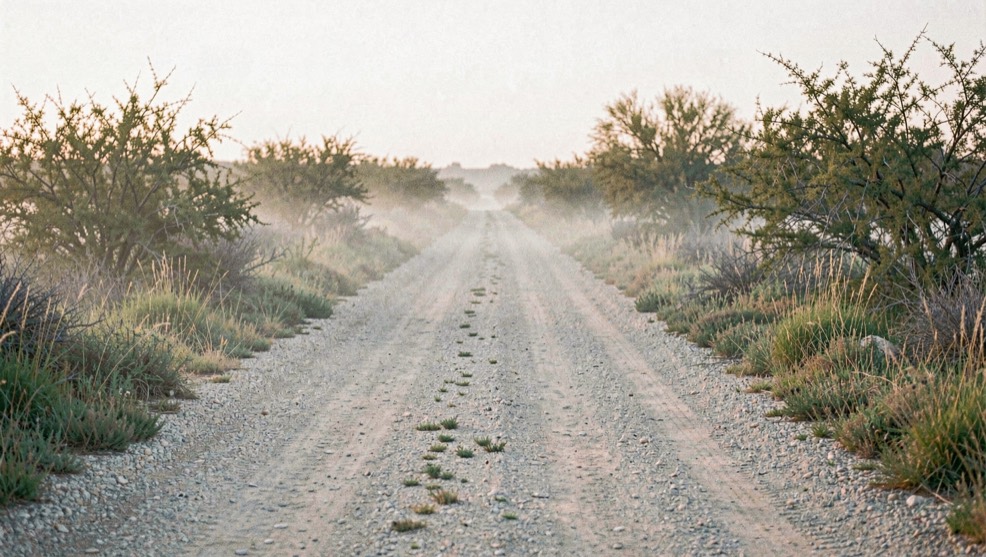
A route follows roads, so it samples the kind of ground roads run through: the margins, the edges, the caliche and the fence lines. That is genuinely quail country, and it is not all quail country. Interior pasture far from any road is not on the route, and whatever is happening there enters the figure only insofar as the roadside happens to reflect it.
The window is narrow in the other two dimensions too. Late summer is one moment in the cycle, after the hatch and before the cold months, and the birds detected are being counted at whatever stage the year has reached by then. The hour matters because bobwhite are not equally detectable at all times of day. All of this makes the figure precise about a defined slice and silent about everything outside it.
Detection is not presence
The deeper limit is that no survey counts birds. It counts detections. Between a bird existing and a bird being recorded sit cover density, weather on the morning, the behavior of the birds themselves and the practical limits of an observer moving along a route. Any of those can change between years without a single bird being added or removed.
This is why the output is an index rather than a census. An index is a quantity that moves with the thing you care about, without claiming to equal it. Treating it as an index is not a caveat, it is the correct use, and it is how the people who run the survey describe it.
How to read an index properly
Compare it to itself. The useful question is how the current figure sits against the same route, the same method and the same window in previous seasons, because the method is held constant and the comparison is therefore meaningful. Ask what the figure is being compared with, and over what stretch of seasons.
Two further habits keep it honest. Do not convert an index into an expectation for one particular pasture, since a regional figure carries no information about a specific place. And do not read a single season's movement as a trend, because in a population that turns over annually a large swing between two years is ordinary rather than remarkable, for the reasons set out in boom and bust.
Seed and habitat indices measure a different thing
Alongside bird counts, the condition of the food and cover base gets assessed in various ways, and those measures answer a different question. A bird count describes the outcome of a season that has already happened. A habitat or seed assessment describes the raw material available for what comes next, which is closer to a leading indicator.
Keeping the two apart avoids a common confusion. Good standing cover late in a summer says something about the nesting structure that may be there in a season to come; it does not retroactively mean the hatch went well. The translation between the two runs through nesting after rain, and it is slow enough that the two indicators can point in opposite directions in the same year.
The check anyone can run
Whatever the survey reports, the input side of the chain is independently readable. National Weather Service and NOAA climate records are public, organized by station and long enough to place a growing season against many others, so what fell on a given area, and when it fell relative to the growing season, is a matter of record rather than of recollection.
Doing that produces something better than an opinion about a number. It gives a season a plausible cause, or shows that the survey figure and the weather record disagree, which is itself worth knowing and usually means the method is telling you about its own limits rather than about the birds.
Why this almanac prints no figure
Every value in this field is annual and superseded. The survey result, the season structure and the rules that follow from them are published by the institutions that produce them, and a copy kept here would age badly while looking authoritative. Naming the document and stopping is the deliberate policy of this desk, explained on the desk page, and the publications themselves are listed on the sources page. The same figures kept at a county's scale, in the deeds and censuses of a place, are the subject of reading a place through its papers.